

Striim is a powerful SAAS platform where data is continuously collected and processed and dispersed to downstream systems. Between continuous real-time collection of data, and its delivery to enterprise and cloud destinations, data has to move in a reliable and scalable way. And, while it is moving, data often has to undergo processing to give it real value through transformations and enrichment. Continuous validation of data movement from source to target, coupled with real-time monitoring is very important to assess the health of the data pipelines. This monitoring can incorporate intelligence, looking for anomalies in data formats, volumes, or seasonal characteristics to support reliable mission-critical data flows.
With Striim’s monitoring feature, you can keep an eye on your data pipeline right from the source until it is streamed to the target.You may monitor the Striim cluster, its applications, and their components using the Monitoring page in the web ui, the console, the system health REST API, or JMX. In this post, we have discussed how to monitor your data pipeline in Striim application using web UI.
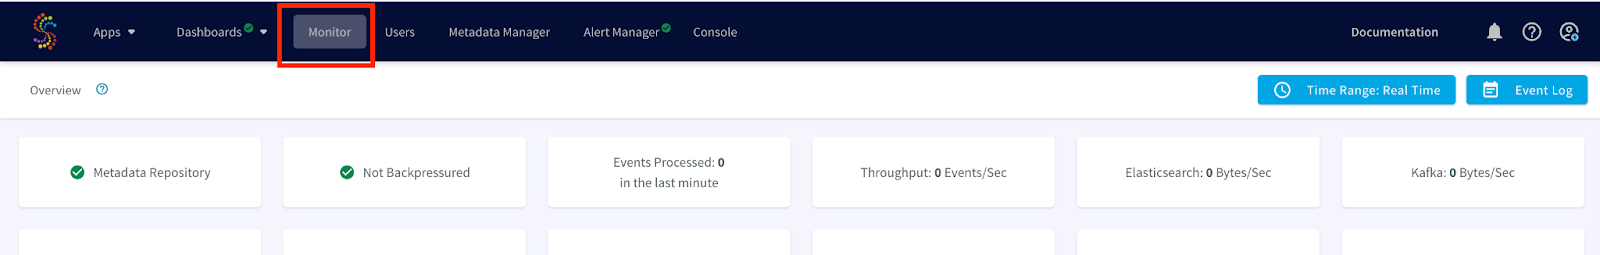
Monitoring using web UI
While your application is running, you can click on Monitor in the uppermost tab to display summary information for the cluster and each of its applications, servers, and agents.
A consolidated overview of all applications would appear as follows:
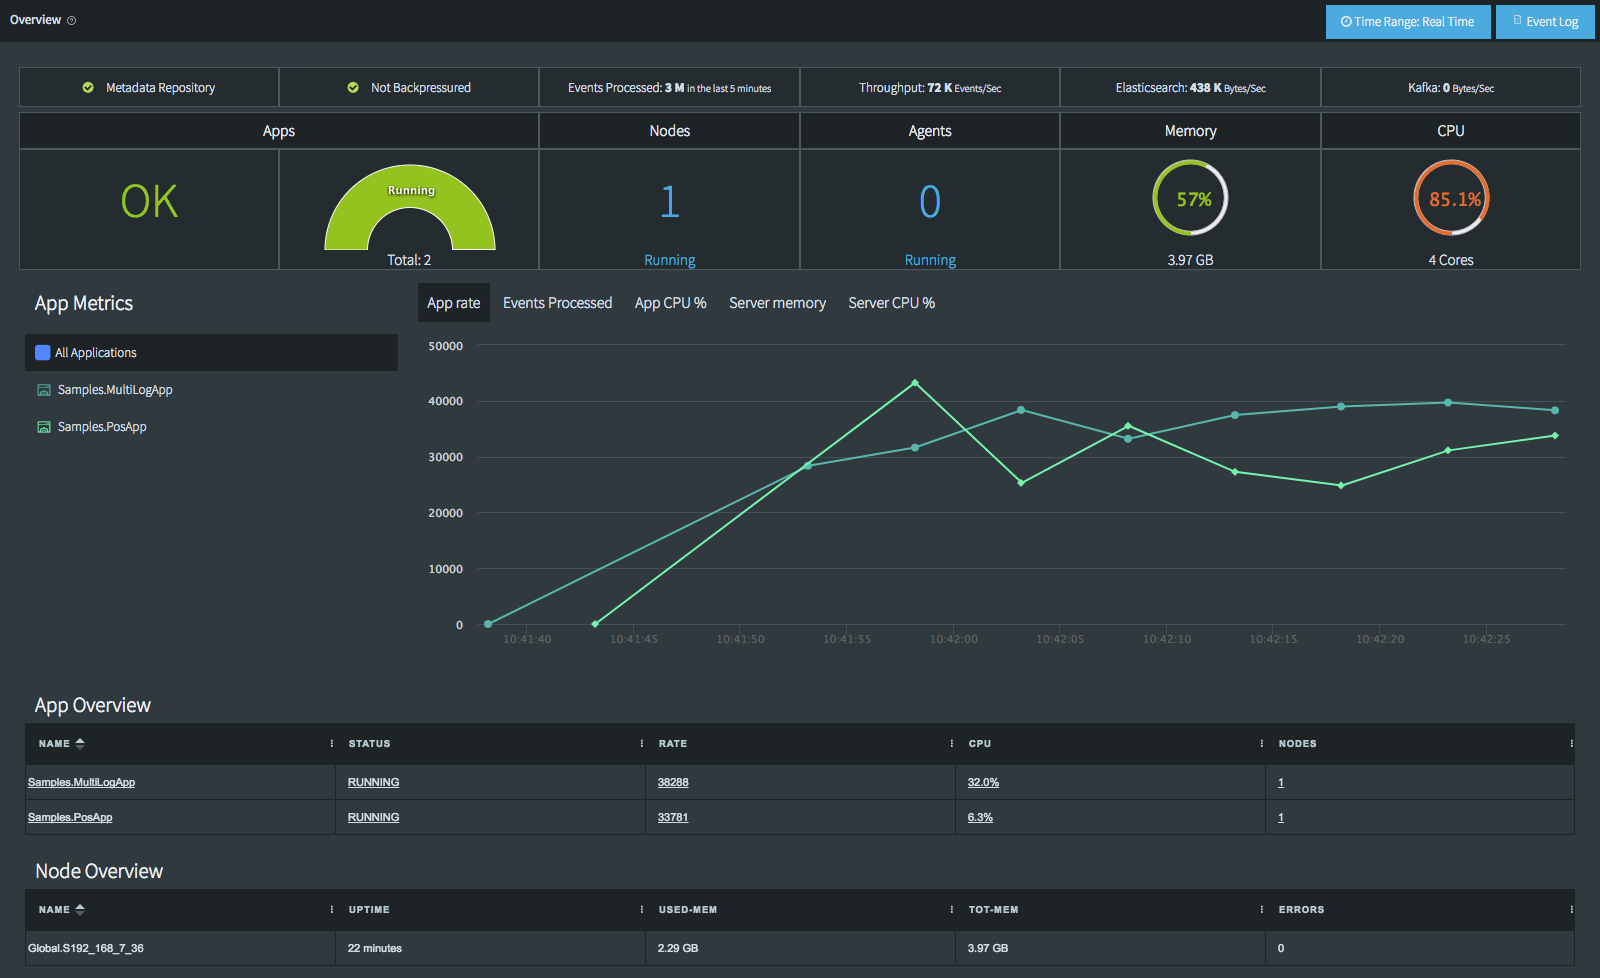
App rate refers to events per second. You can graph the statistics of Events Processed, App CPU%, Server Memory or Server CPU% from the monitor dashboard.
You can also select the time range to look at older data for every application. By default, the Monitor page shows the most recent data. You can click Time Rage on top right to monitor data for a specific time.To monitor an individual app, click its name in the Apps Overview list or select Monitor App from the app's ⋮ menu on the Apps page.
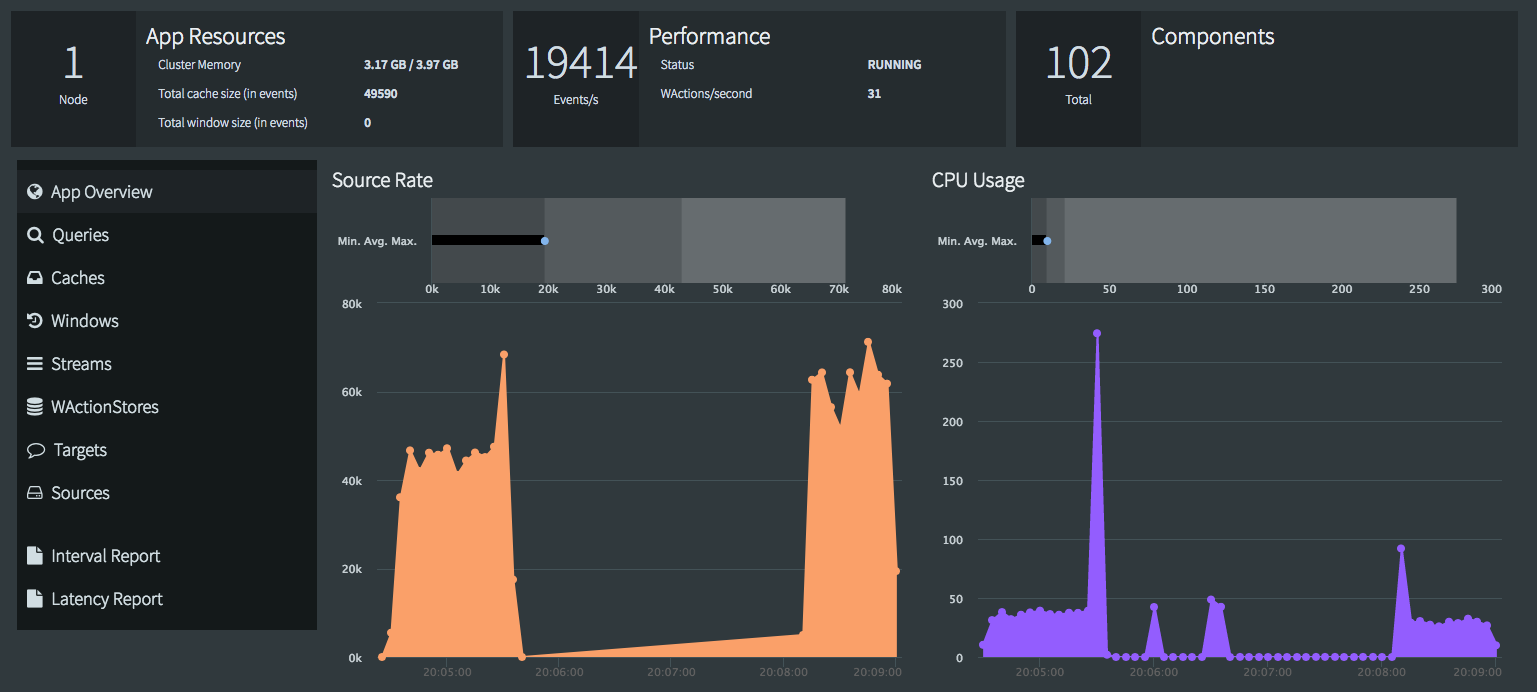
The tabs in the left show statistics for components of a particular type. The images below show details of App Overview and the WAction Stores.

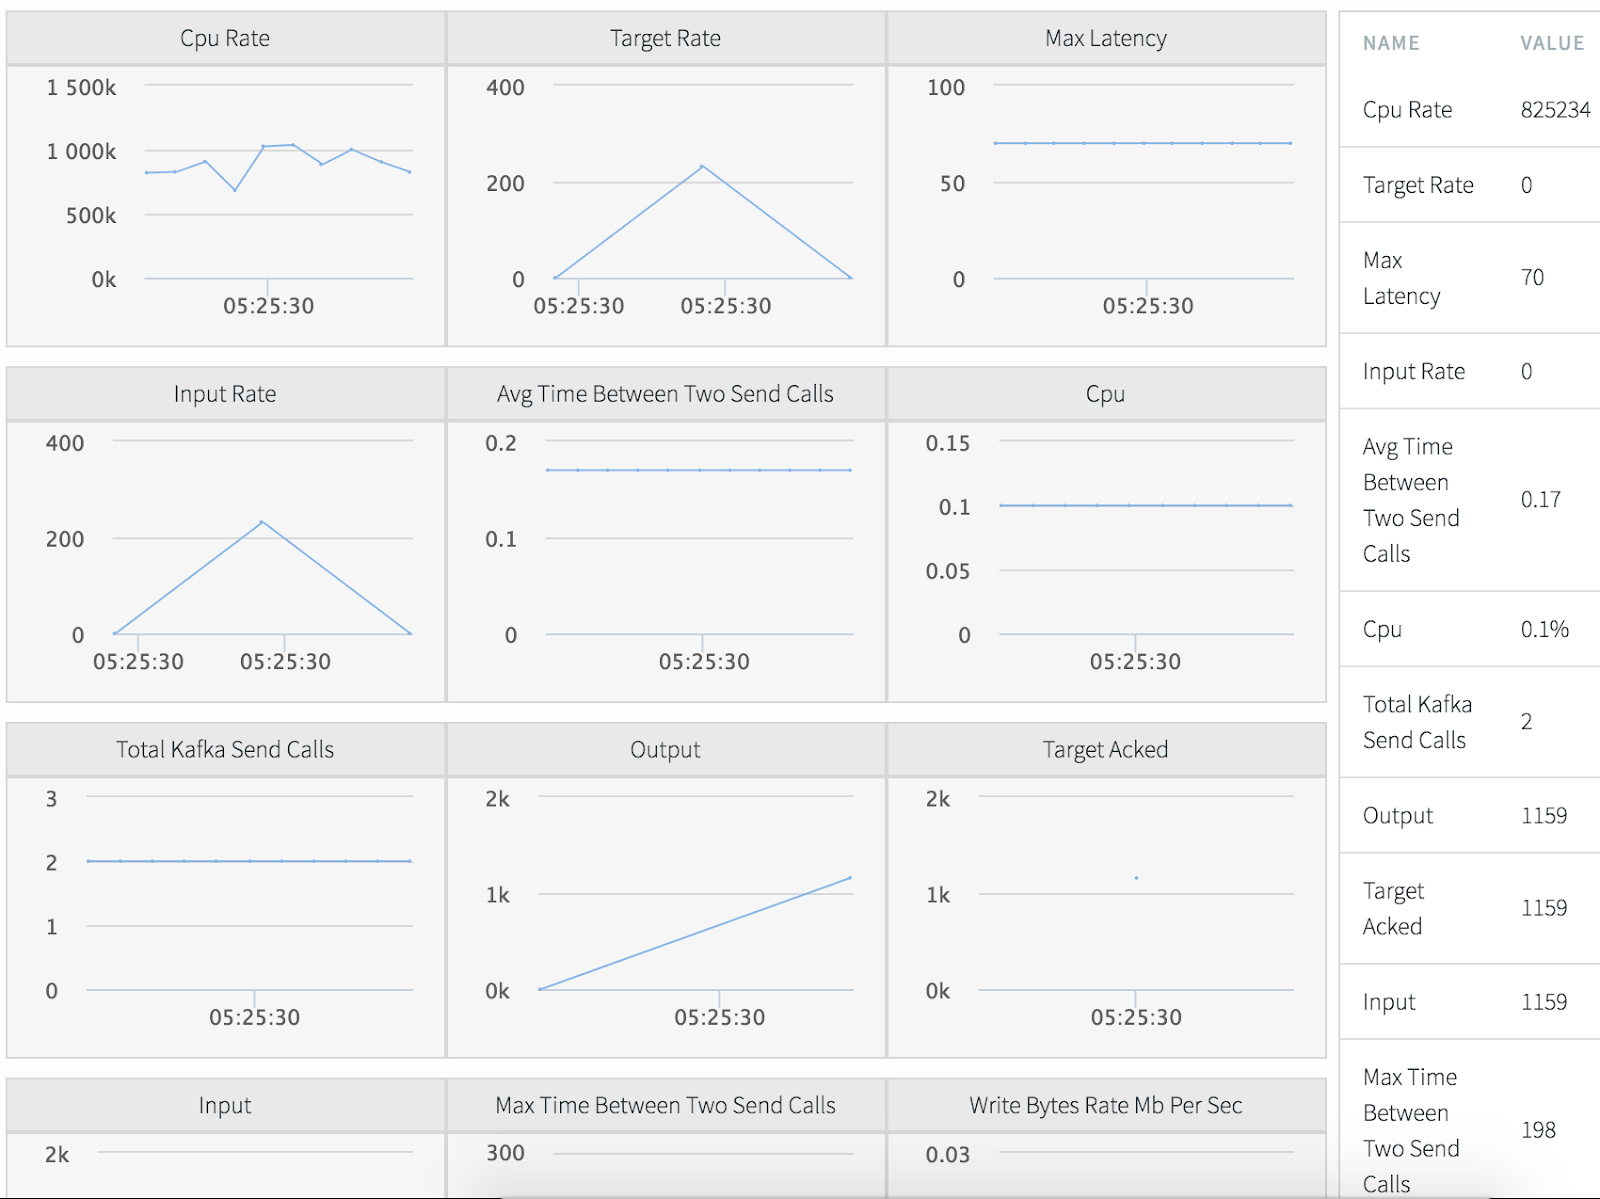
When you see a More Details button, you can click it for more detailed information. For example, for KafkaWriter, you will see something like this:
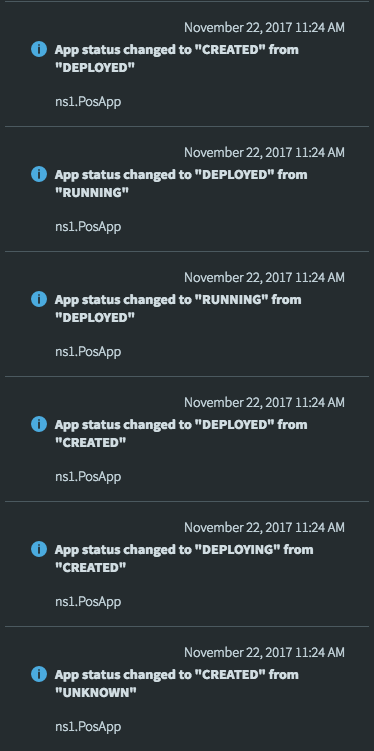
Click Event Log to see application-related errors and status changes for all nodes in the cluster. The following status changes reflect PosApp being loaded, deployed, started, stopped, and undeployed. No status change is logged when you drop an application. By default, the event log shows status changes and errors for the past five minutes from all nodes (there may be a delay before they appear). Use the filter drop-downs to select a narrower set of data. If you choose a time range, the event log will not be updated with new events until you clear the filter.
In this post we have given a high level overview of monitoring features on Striim’s web UI. To learn more about Striim’s powerful Change Data Capture, please feel free to reach out to our integration experts to schedule a demo, or try Striim for free here.